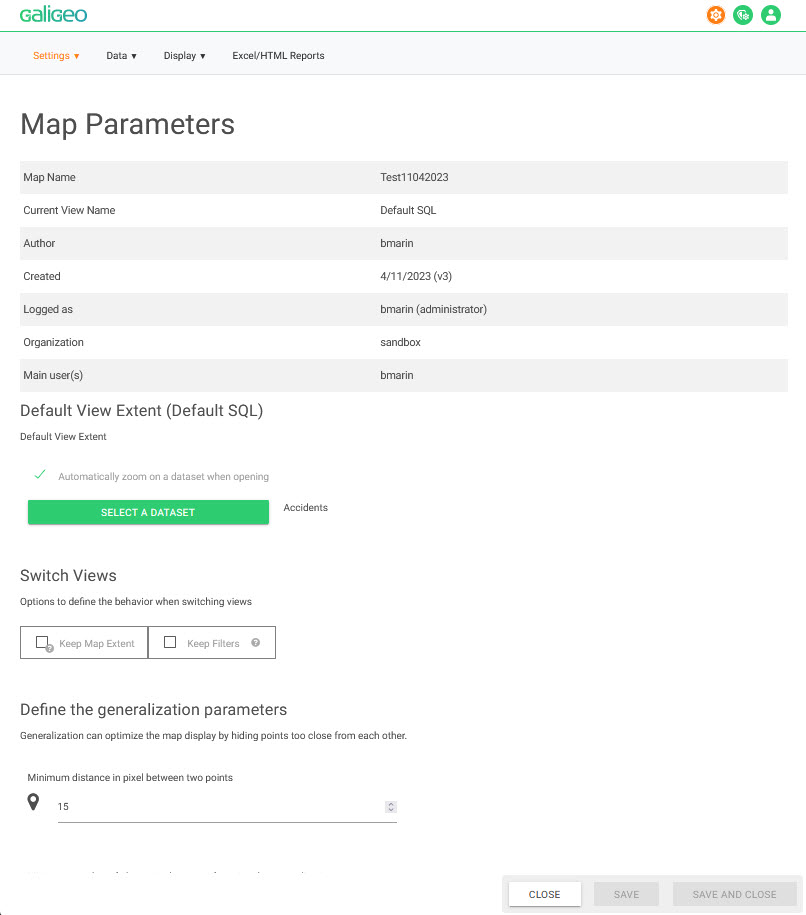
The settings page allows the managing and defining of all advanced parameters of the current map.
Only authors have access to the settings page. It
is accessible from the vertical menu by pressing on the  button.
This page allows the configuring of the following elements of the application:
Only the authors can access this settings page.
This page allows the configuring of the following elements of the application:
When the option is checked, you can choose a dataset from the view in order to position and zoom automatically on the corresponding dataset at the opening of the map as well as at the dynamic refreshing of the map/view.
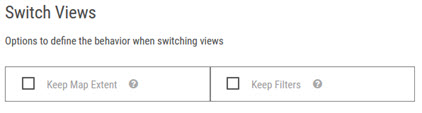
This section allows the configuration of the map behavior when changing views from the Layers panel.
There are 2 options available:
Parameter |
Role |
Keep Map Extent |
When this option is not checked, the view opens at the saved extent, or the data set extent selected at opening. Otherwise it is kept at the actual extent. |
Keep Filters |
When this option is not checked, the view opens with the filters selection from the last save. By checking the option the filters are kept as they were at the view switch. |
This functionality allows the improving of the displaying and navigation performance on points layers where there are a big number of objects to be displayed.
It allows the dynamic hiding of points or symbols that visually appear very close one to another (distance in pixel). The hidden points appear as we zoom in or when the total number of displayed points is under a certain predefined level.
The author can specify the following generalization parameters:
the minimum distance between two points defined in pixel; we recommend a distance from 10 to 15 px for a layer with a great number and a high density of points.
the minimum number of objects in the extent for using the generalization
Regarding the labels, it is possible to define a generalization factor between 0 and 4. By setting the cursor on 0, all the labels are displayed. The value 4 allows a big spacing between the labels.
The date format indicates how dates data types must be displayed in the user interface. To know if a specific indicator is recognized as a date, you can go to the data panel > edit dataset > data configuration.
The printing zone is never completely identical to the visible zone on the map because according to the scale the printing tool uses the closest zoom level. This difference is linked mainly to the ration of height/width of the printing template that is different of the one of the map.
The configuration of the zoom factor allows to artificially compensate the extent of the print. A value superior to 1 enlarges (zoom out) the extent of the printed map whereas a value inferior to 1 will slightly zoom in on the result.
By default, all users have access to the maps with the role that was assigned to them in the Administration. From the tab “Share” from the settings page it is possible to overwrite this behaviour:
Either for blocking the access for certain users
Or for overwrite the role to be used for one or more users
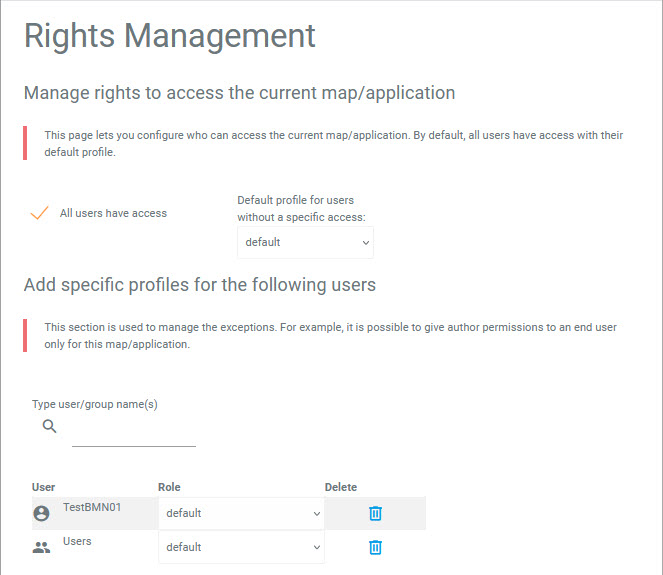
The sharing page is divided in two sections:
This section allows defining the rights by default for the actual map.
 Defined
if the map is public or private.
Defined
if the map is public or private.
When the map is public, it is impossible to overwrite the default role for every user that us the map.
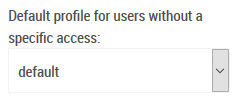
The value “default” means that the default role will be used. It is possible to choose all the existent roles in the list (except administrator).
|
If a map is private, by default only its creator can access it. |
The second section of the page allows adding exceptions to the previously defined rules.
Here it is possible to add users or user groups, and define their role on the map. Here furthermore, when the “Default” role is selected, the user accesses the map with the role by default.
The management rules are the following:
The exceptions defined in this section have priority over the general rule.
When a user is present in several groups, the first group declared is then the one taken into account.
A rule pertaining to an individual user has always priority over a rule pertaining to a group. For instance in the screenshot above, if “user” belongs to the “Canada Users” group, then the rule “user -> author” which will be taken into account.
It is possible to customize the Info-Windows by dataset. This customization needs knowledge of the HTML language and allows a very configurable outlook (according to what the HTML/CSS language allows to do).
The customization of the info-window for a dataset is done by activating the “custom” switch from the Settings page, and by clicking on the arrow close to the name of the data set:
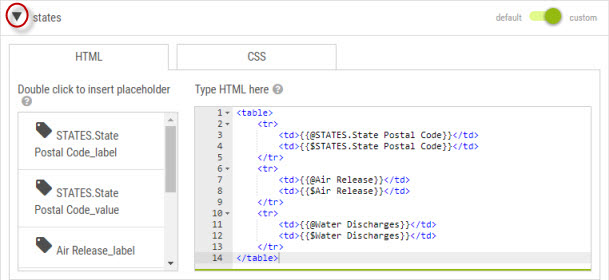
The author writes the content in HTML in the right side panel and has the possibility to insert variables from the left panel. The variables represent the list of attributes of the dataset (value label).
This customization is reserved to the authors that master the HTML and CSS language.
The author can specify which features/functionalities are available in the toolbar, and on the current map generally.
As indicated, reopening the map is necessary in order for the changes to become visible.
The filter settings page is used to configure the dynamic filters displayed on top of the map.

A filter is defined from a list of values for a field of a given dataset (a dataset listed in the data panel). Authors can add / delete filters from the settings page. For each filter, it is possible to customize the name and the type (MULTI: multiple values selectable, MONO: only one value selectable at a time).
When one or several filters are defined on a map, those filters are displayed as dropdown lists on top of the map. Users can then check/uncheck some values to filter the layers on the map.
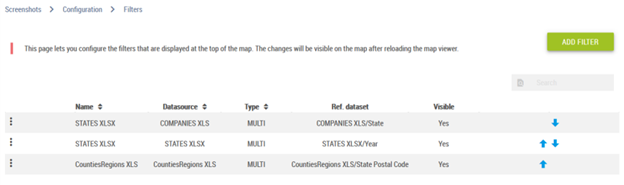
The filters are managed from the settings page by clicking on the Data/Filters menu on the settings page.
This page lists the existing filters, and allows to add new ones, or delete existing ones.
A filter is defined by the following criteria:
A name
A dataset that provides the filters values
The visibility on the map (sometimes it is useful to have a filter invisible in order to use it in a report)
A refreshment on the first value or not. When this box is checked, the first value of the filter is automatically selected each time the map is opened
A set of levels that could be of simple selection (MONO) or multiple (MULTI)
By default, a filter has only one level. The adding of supplementary levels allows the creating of a hierarchy between several nesting criteria. For instance State>Counties>ZIP Codes.
Each level is defined by a field providing the filter values and optionally an alias. The alias is useful when the used filter values are using a code and we would like to present the user some more friendly names. For instance a FIPS can be represented by a name through an alias. It is also possible to choose, if we so desire, to sort the values of the level alphabetically, or not.
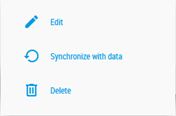
It
is possible to modify, synchronise with the data, or to delete a filter
by clicking on the  button of the corresponding filter.
|
The actualization of the filters from the settings page creates automatically a link between the filters added and the corresponding dataset. This link is visible from the Filters tab from the Data panel. It is also possible to link several datasets to a same filter as described in the following section. |
Using the data panel, authors can link a filter with a dataset:
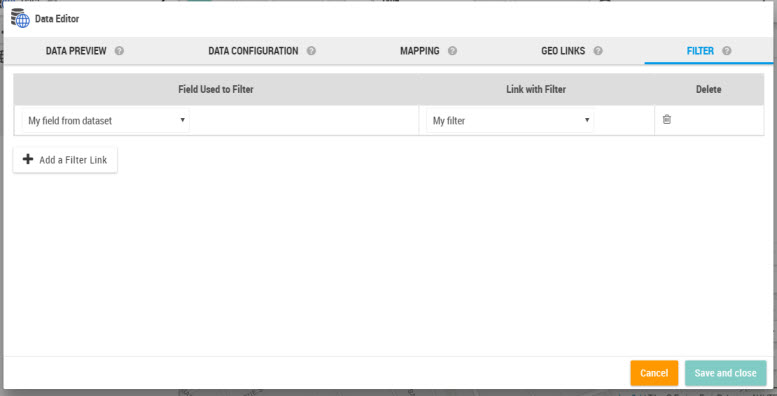
It is this association filter/data that allows the filtering when selecting values.
|
A filter is not necessary used to filter the dataset it is based on. For example, one can use a list of values from an XLS file or a SQL query to filter a layer from the catalog. The only condition is that the filter values match with a column of the filtered dataset. |
The author can add webservices by entering the URL of the service or of the layer. This functionality allows to enrich a map with geographical data coming from an external service in a rapid mode (ArcGIS or WMS).
For each layer it is possible to:
customize the name, the category and the URL
choose the visibility status by default (visible/invisible)
choose to display the legend
filter the layer according to an existing prompt (by selecting the field that needs to be fed)
delete it from the list
move it up and down inside the group (this order will be reflected in the Layers panel)
the groups can also be moved up and down and relative to the layers in the Layers panel using the arrow buttons in the group header
whole groups can also be deleted using the recycle bin button in the group header
groups names are editable
manage the labels visibility (if the layer is supported) through the labels icon associated to every layer (in the Layer management panel)
|
Warning: in order that the labels on Webservices to be able to be managed dynamically through the user interface, it is necessary that the “dynamicLayers” parameter of the map service to be supported. |
The adding of an Webservice is done by:
Entering the REST URL of a layer from ArcGIS Server
For instance: http://showme.galigeo.com/arcgis/rest/services/USA/MapServer/1
Indicating the URL of the service to be added, in which case all the layers of the service are added automatically
For instance: http://showme.galigeo.com/arcgis/rest/services/USA/MapServer/1
|
In order to be faster, it is possible to get the set of Webservices from another map using the button “Copy Webservices”. This operation replaces the Webservices of the current map with those of the selected map. |
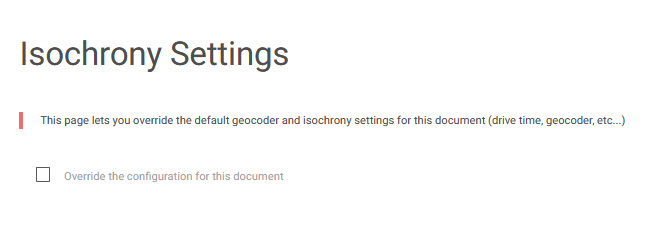
Here it is possible to configure the default thresholds for isochrones in the TM projects.
The thresholds are configured for the whole application in the Administration and if one desires to have special settings for a map, first one has to check the checkbox "Override the configuration for this map". The configuration fields will appear in a similar manner as on the Administration page.
This page is linked to the Territory Manger. Therefore, it is displayed according to the application license level. The TM extension is necessary.
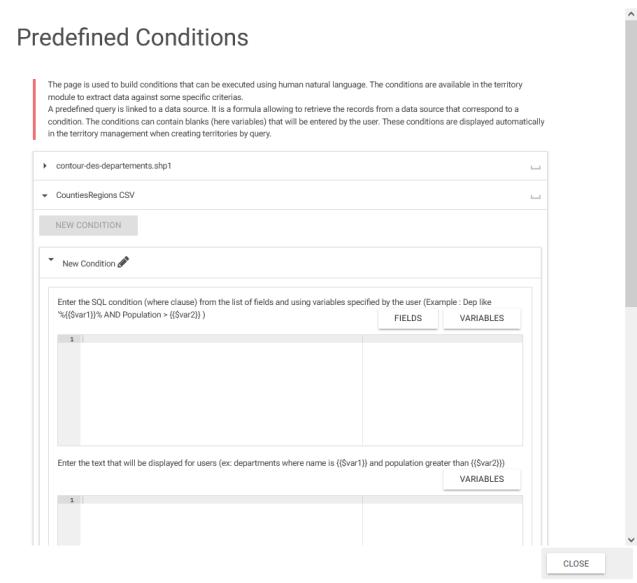
A predefined query is linked to a data source. It is a formula allowing to retrieve the records from a data source that correspond to a condition. The conditions can contain blanks (here variables) that will be entered by the user. These conditions are displayed automatically in the territory management when creating territories by query.
For instance, if a data source represents buildings, we could define the following condition: “M2>{{$value}}” where {{$value}} is a variable that will be entered by the user.
The field “Form” allows to associate a phrase comprehensible to a user for the defined condition. In our sample, we have “Surface superior to {{$value}}”.
The advantage to defining these conditions in the map settings is to provide the user with ready-made formulas for data extraction purposes. The user fills in the blanks of a intelligible phrase without knowing the formulas used in the condition.
The SQL driver allows defining a dataset from an SQL query that is ran from an Oracle, Postgres, or SQL Server database. The queries are executed by request according to the map extent (for the queries having a geometric field), which allows the display only of visible data. This solution avoids also a join mechanism less performant that forces the querying of attribute data w/o special criteria.
The queries are defined from the “SQL Queries” menu from the settings page.
The adding of a data source it is done from the Administration from the Datasources tab.
Click on the button “ADD A DATASOURCE”
Fill in the fields of the form
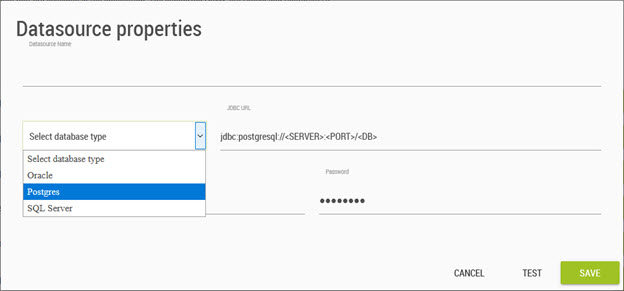
The JDBC URL allows referencing the placing of the database (type, server, port, scheme). Only the the Oracle and Postgres databases are supported.
By default, Galigeo suggests a JDBC URL model according to the supported database.
The adding of a query in a map is done from the settings page Data > SQL Queries > Add Query

The spatial queries have to have the following characteristics:
The first field has to be of integer type and has to correspond to a unique ID
The second field is called “geo-dimension”, and corresponds to the business identifier (e.g. postal code, customer identifier, etc.) used to group the territories in the TM tool (e.g. by postal code). This identifier is useful only in the case of a spatial query.
The query can optionally contain a geometry type field (SDO_GEOMETRY for Oracle and ST_GEOM for Postgis). The dataset becomes then native spatial and can be represented on the map w/o needing the specification of any particular mapping.
The existent queries are displayed in the form of table in the settings page. The edition of a query allows their visualising and their testing (display of a sample data), to update them (saving of the SQL query) or to delete them.
Each of the queries appear in the Data panel of the map. It is then possible to define layers from this data.
It is also possible to define non-spatial queries, i.e. those that do not contain geographical fields. In this case it is possible to define either a join with an existent mapservice or to use the XY2Map functionality as the query contains latitude/longitude fields.
To note that in the case of a query using the XY2Map functionality, the data are queried by the map extent. This allows keeping a advantageous gain in performance.
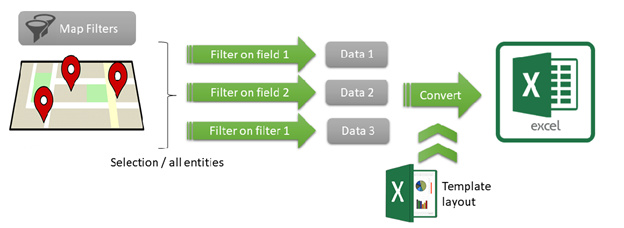
Galigeo can produce some reports based on the Excel or HTML format. A report is composed of a list of datasets from the map. By default each dataset will appear on a separate sheet and it is possible to specify a custom layout based on a template.
A
report can be called directly from the report panel  or can be generated from a selection (a single object from the info window
or multiple record from a selection).
or can be generated from a selection (a single object from the info window
or multiple record from a selection).
Reports are defined from the “Excel/HTML Reports” tab of the configuration page.
This page allows to define multiple reports.
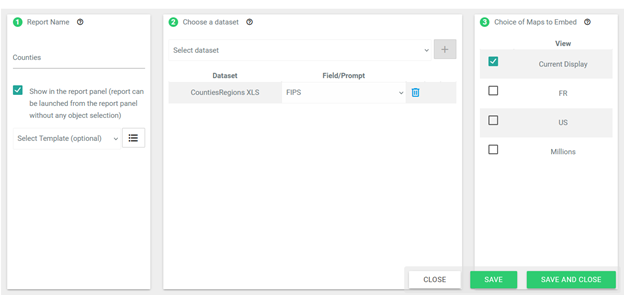
A report is composed of:
A report name
A list of dataset. Each dataset can be optionally filtered based on a field or an associated filter
An Excel or HTML template (optional – see sections 9.10.3 and 9.10.4)
If the checkbox “Show in report panel” is selected, then the report will directly appear on the left panel and can be downloaded without doing a geographic selection.
|
If a dataset has some filters, the report generation take those filters into account. |
At the end, click on “SAVE” to add the report to the list.
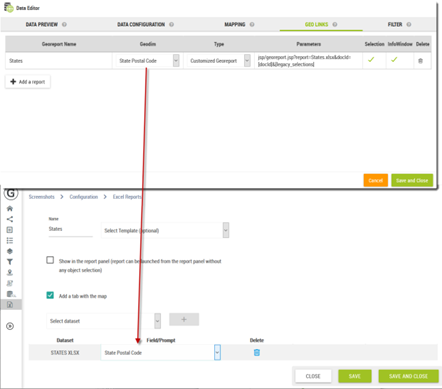
It is possible to associate a report to one or multiple dataset in order to run the report against a specific area. We call that king of reports “georeports”.
The reports are associated to a dataset through its url using a geolink (see section 6.6 Geo links). The geolink appear at various places of the map (infowindow, selection, territory manager) and is used to call the report with a geographic selection.
To make this work, the geographic selection (represented by a list of identifiers) must corresponds to the dimensions used by the report.
For example, if a geolink sends a list of state abbreviations, the filtering will work only if the report consumes also some state abbreviations.
If there was no template defined by the user, the application generates a default template.
|
The default MS Excel template is not configurable. |
E.g. there is a georeport “test” whose ID is (1).
At the moment of result generation, the program verifies if in the repository <xlsTemplate> exists a file "test.xlsx" or “1.xlsx”. If there is none to be found, it searches a file "test.xls" or “1.xls” then "test.xlsm" or "1.xlsm".
In this example none of the files exist. Then the default template will be used in order to get the following result:
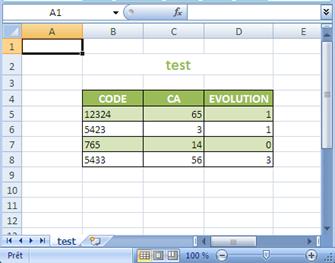
In the MS Excel file generated there are as many tabs as there are queries in the georeport/report, with the following characteristics:
A query = a tab
Query name = tab name = table title
It is equally possible for the user to create his/her own templates.
It is enough
to click on the button  and
a window will open where it is possible to select an already existing
template from the list, or add a new template by clicking on the “ADD
NEW TEMPLATE” button and import one from your local workstation.
and
a window will open where it is possible to select an already existing
template from the list, or add a new template by clicking on the “ADD
NEW TEMPLATE” button and import one from your local workstation.
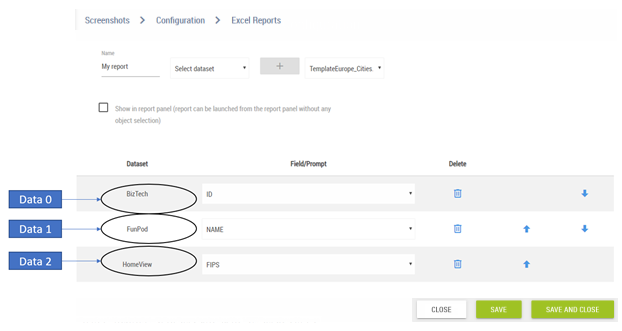
Query Configuration
In this example, we have the following dataset configurations:
Implementing the Template
The template to implement has to have certain characteristics:
Title: it has to be defined in the template.
Header: the column names have to be defined in the template.
Named Cells: when creating a model, it is necessary to indicate some key words in order for the program knows from which line and which column it has to begin to insert the data. There is one key word: IND
How to implement a template steps:
After
creating the georeport w/o template in the Settings/Excel Reports
tab, following the process outlined in the 9.10.1 & 9.10.2 subchapters,
click on the Download button  associated
to the georeport in the Excel Reports screen
associated
to the georeport in the Excel Reports screen
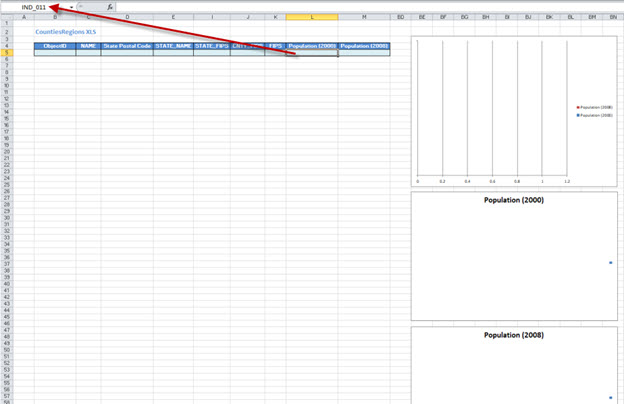
Open the Excel file that has all the records of the dataset specified, and set it to accept modifications
The columns associated with the fields have already a name IND_QI, where Q is the spreadsheet number (starting with 0), and I is the number of the field in the dataset (starting with 1)
Remove the lines but the first one underneath the header of the table
You can then customize the template. For example change the title to be unbound and not centred, modify the colours as you see fit (title font, header font, cells filling), or add an image with a logo
|
If you need to eliminate some superfluous/unnecessary columns/fields from the actual file, it is recommended to hide them instead of deleting them, thus the named fields order is not disturbed |
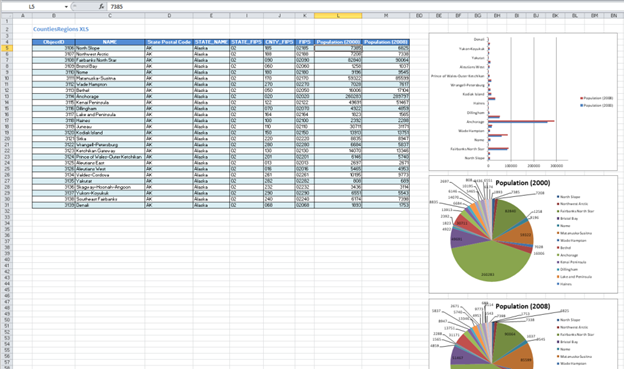
If there is a need to add some formulas to fields, for instance a sum for a numeric field, this formula can be added at the bottom of the table, i.e. underneath the only line, and the formula has to contain instead of the range of the column just the IND_QI field name. For instance if you want to calculate the sum of Population (2000), where this field has the name IND_011, then the sum formula that is to be entered in the total cell would be: “SUM(IND_011), and when the table will be populated, then it will know that the formula is for the whole range of the column
It is possible also to add diagrams in those templates, also keeping in mind that when data is assigned to the diagram, instead of column ranges, the name of that field has to be used, e.g.in a histogram series values instead of “=CountiesRegionHystPie.xlsx! $L$5:$L$10” you have to use “=CountiesRegionHystPie.xlsx!IND_01”. Thus the values will be added properly to the diagrams as well
For instance the template below:
will look, when called from a selection:
The HTML templates automate the generation of a webpage containing the defined data defined in the report configuration (data + images).
An HTML template is built as follows:
<!DOCTYPE html>
<html>
<head>
<!-- IMAGE {id: "map1, width: 925, height: 590} -->
<!-- IMAGE {id: "map2", width: 925, height: 590} -->
<body>
<script type="module">
// START_GGO
// END_GGO
</script>
</body>
</html>
The tags <!-- IMAGE {id, width, height} -->indicate which are the images present in the report
For a template to be valid, it must contain two tags // START_GGO and // END_GGO. When running, Galigeo replaces the inside of its tags with two constants “data” and “images”.
"data” lists all the datasets associated with the report |
const data = { req1: { data in geojson format }, req2: { data in geojson format }, } |
"images" lists all the images in base 64 format |
const images = { map1: "data:image/png;base64, iVBO...", map2: "data:image/png;base64, iVBO...", } |
Running a report with an HTML template automatically opens the output in a new browser tab. Thanks in particular to the power of JavaScript, it is possible to invoke a complete application with this solution.


